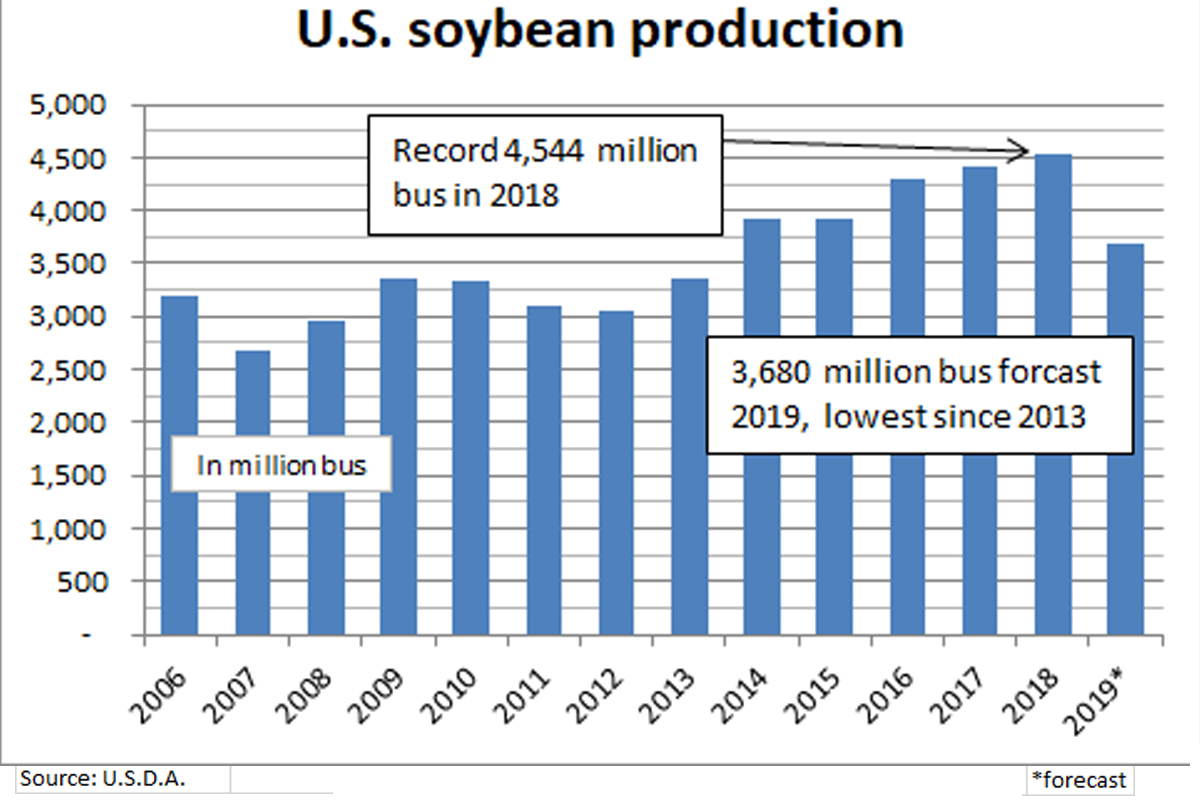
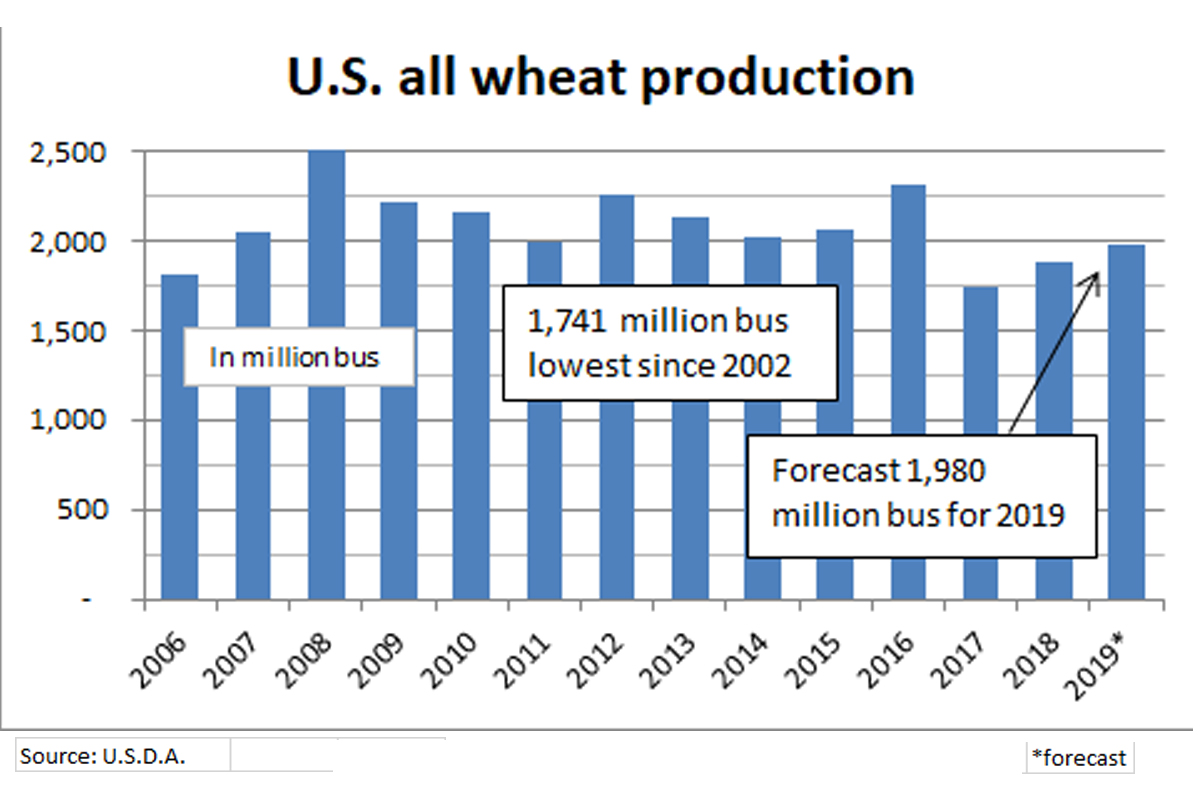
WASHINGTON — The U.S. Department of Agriculture in its Aug. 12 Crop Production report forecast 2019 U.S. production of corn at 13,901 million bus, down 3.6% from 2018, soybeans at 3,680 million bus, down 19%, and all wheat at 1,980 million bus, up 3.1% from the July forecast and up 5% from 2018.
Average corn yield in 2019 was forecast at 169.5 bus an acre, down 6.9 bus, or 3.9%, from 176.4 bus in 2018. Corn planted area was estimated at 90 million acres, down 1.7 million from the June Acreage report but up 900,000 acres from 2018. Harvested area was forecast at 82 million acres, down 1.6 million acres from the June report but up 300,000 acres from 81.7 million acres in 2018.
The average soybean yield was forecast at 48.5 bus an acre, down 3.1 bus, or 6%, from 51.6 bus last year. Planted area was estimated at 76.7 million acres, down 3.3 million acres from the June Acreage report and down 12.5 million acres from 2018. Harvested area was forecast at 75.9 million acres, down 3.4 million acres from June and down 12.2 million acres, or 14%, from 88.1 million acres in 2018.
If realized, corn production would be the lowest since 13,602 million bus in 2015. Record high production of 15,148 million bus was harvested in 2016. Soybean production would be the lowest since 3,357 million bus in 2013 with record high outturn of 4,544 million bus harvested in 2018.

The U.S.D.A. corn production and yield forecasts were above the full range of trade expectations, that averaged 13,164 million bus and 165.3 bus per acre. The U.S.D.A. corn yield estimate was possibly the largest surprise to the trade, which had expected a decline from July projections based on adverse weather and delayed planting.
The U.S.D.A. soybean production and yield forecasts were within the range of trade expectations, with production below the trade average of 3,783 million bus but yield above the average of 47.5 bus per acre.
Chicago corn futures were down the 25c-a-bu daily limit nearby through May 2020, while soy complex futures also were lower, with soybeans down about 11c a bu shortly after the 11:00 Central time release of the U.S.D.A. data.
The U.S.D.A. all-wheat production forecast of 1,980 million bus was at the high end of trade expectations, which averaged 1,926 million bus. Wheat futures also were lower after the U.S.D.A. Crop Production and World Agricultural Supply and Demand Estimates reports, with Kansas City and Chicago wheat futures posting the largest declines.
Production of spring wheat other than durum was forecast at 596,660,000 bus, down 1% from the July forecast and down 4% from 2018 based on an average yield of 49.2 bus an acre, up 2 bus from July and up 0.9 bu from 2018, and harvested area forecast at 12.1 million acres, unchanged from July but down 6% from 2018. Production of hard red spring wheat was forecast at 565,753,000 bus, down 4% from 2018.
U.S. durum production was forecast at 57,326,000 bus, down 1% from July and down 26% from 2018 based on an average yield forecast at 42.3 bus an acre, down 0.6 bu from July but up 3 bus from 2018, and harvested area was forecast at 1,356,000 acres, unchanged from July but down 31% from last year.

Winter wheat outturn was estimated at 1,326,223,000 bus, up 3% from July and up 12% from 2018. Average yield was estimated at 53.2 bus an acre, up 1.4 bus from July and up 5.3 bus from 2018. Harvested area was estimated at 24.9 million acres, unchanged from July but up 1% from 2018. Of the total, hard red winter wheat production was estimated at 839,834,000 bus, up 4% from the July estimate, soft red winter wheat was estimated at 257,489,000 bus, down 1%, and white wheat at 228,900,000 bus, up 1%.
It was the first survey-based forecasts for corn and soybeans. Estimates were based on conditions as of Aug. 1.
The U.S.D.A resurveyed corn, soybean, sorghum and cotton growers in 14 states in July who had indicated acreage not yet planted when surveyed for the June Acreage report due to this year’s adverse weather.


