When it comes to viewing the big picture, looking toward the past allows businesses to see how far they’ve come and prepare for what’s ahead. That’s why Kansas City-based Cypress Research traveled all the way to 2002 for its recent analysis of the Economic Census of Manufacturing data that provides the most complete information on the commercial baking industry every five years.
In addition to framing the state of the industry, the report lays the foundation for identifying those underlying factors that have been impacting industry sales and capital expenditures over the long run. Cypress Research supplemented full Census data with government statistics from the Annual Survey of Manufacturers (ASM). The data from a sample of manufacturers offers comprehensive information about the entire category.
From a 35,000-foot perspective, mega trends such as the dramatic dollar swing from eating at home to dining out over the past decade have prompted retailers and others to offer takeaway foods and in-store meal kits as alternatives to what restaurants offer, suggested Robb MacKie, president and chief executive officer, American Bakers Association.
Such lifestyle and retail changes are redefining how bakeries operate. Specifically, from a production perspective, perhaps the greatest transition has come as the industry segues from an era of consolidation to a period of capital reinvestment. And in the grand scheme of things, Mr. MacKie added, that ongoing investment reflects the strength of the industry and predicts good news for the future.
“Companies that are successful today have been true to their capex and to steadily reinvesting back to their businesses,” he noted.
‘Steady-Eddie’ growth
The comprehensive analysis by Cypress Research showed the value of shipments in net sales for the overall commercial baking industry rose 18% to $78.7 billion in 2007 from $66.8 billion in 2002 and another 18% to $92.6 billion in 2012 before slowing down in recent years.
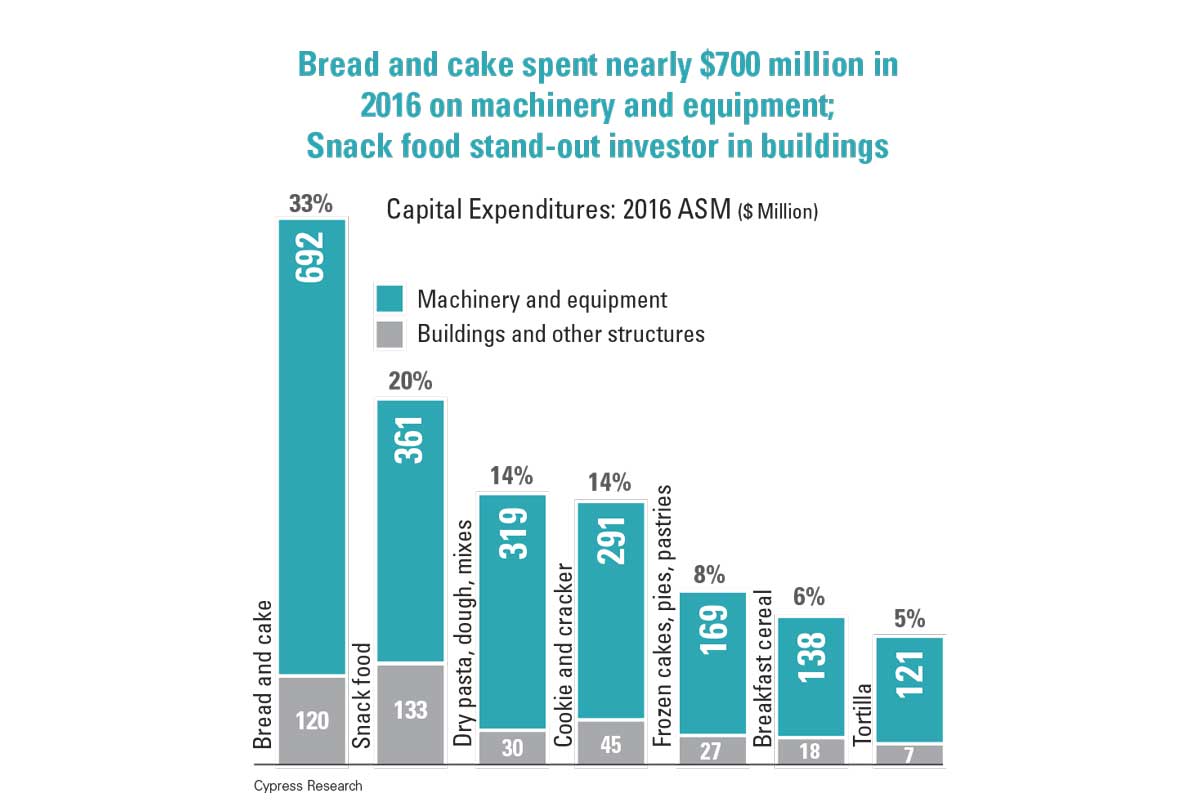
Bread and cake accounted for one-third of the value of shipments, followed by 23% for snack foods. The remainder included dry pasta/dough/mixes, cookie/cracker, breakfast cereal, frozen cakes/pies/pastries and tortillas.
“We’ve never been Apple or Google,” Mr. MacKie said. “We’ve always been the steady-Eddie, strong and stable industry, and all of the data shows that.”
Shipments of bread and cake have risen at modest rates, anywhere from 8% to 9%, in the five-year periods leading to 2007 and 2012, while the cookie/cracker segment trailed at a slower rate, even declining in recent years.
As the value of shipments increases, the total number of establishments — or production facilities — has remained steady over the years, but they have declined in some key segments, according to census data. Such declines can be attributed to decades of rampant consolidation starting in the 1980s as major players gobbled up smaller regional ones in what remains a highly diversified baking industry. By 2000, the largest entities in the industry began acquiring one another. Multinational companies then began buying U.S. bakeries.
Most recently, venture capital and other investment firms started getting into the action in a big way.
“They are the ‘new bank’ for many businesses,” Mr. MacKie said. “And they’re investing for the long run.”
Mega metamorphosis
In the wake of consolidation that has changed the face of the industry, there seems to be a wave of capital spending taking on greater emphasis in recent years.
“I think we’ll look back at this period and say, ‘Wow. This was a big uptick in investment,’” Mr. MacKie predicted.
Historically, about 85% of capital expenditures targeted machinery and equipment, with the remainder on buildings, according to the analysis by Cypress Research. Overall, census data showed that total investment rose steadily to $2.37 billion in 2012 compared with $1.86 billion in 2002, despite the impact of the Great Recession and financial crisis that made it nearly impossible for businesses to borrow money from 2008 to 2010.
Looking forward, Cypress Research projected that cap spending may reach $3.03 billion in 2022 and approach $3.89 billion by 2032. Marjorie Hellmer, president of Cypress Research, noted those conservative projections are based on the average annual growth rate between 2002 and 2012 of 2.3% for machinery/equipment and 4.9% for buildings.
“Given the Census’ historical trends, anticipating an annual average increase of 2% for capital expenditures in commercial baking seems reasonable during the next 13 years,” Ms. Hellmer said. “A 2% annual increase in capital expenditures certainly isn’t a declaration of bullishness on the industry’s part. Rather, it plays into the industry’s reputation for conservative investments in plants, reflecting the strategy to enable facilities to make products that are in demand.”
But there is reason for greater optimism because bakers have better tools to determine and even justify the return on investment (R.O.I.) for equipment purchases, said Dave Van Laar, senior adviser to A.B.A.’s president and c.e.o., and longtime veteran of the cookie and cracker industry.
Since 2012, he observed, more sophisticated and user-friendly data management systems are allowing operations to pinpoint bottlenecks, reduce downtime and garner higher yields that achieve a quicker R.O.I. than in the past. In addition to replacing aging capacity with new technology, companies are enhancing food safety processes through Global Food Safety Initiatives to comply with the onslaught of requirements from the Food Safety Modernization Act.
Continued investment in people and operations, Mr. Van Laar added, will keep the industry strong for the foreseeable future.


