 With the decision to withdraw its application for a draft Order for a breadbasket checkoff, the wheat-based foods industry is planning to narrow further the segment of the grain-based foods industry that would be encompassed in a checkoff program. While the approach may be the best way forward to a successful launch, industry leaders should also be thinking about ways to widen the tent. This exploration should extend beyond wheat and toward other grains grappling with challenges similar to those facing the wheat milling and baking industries.
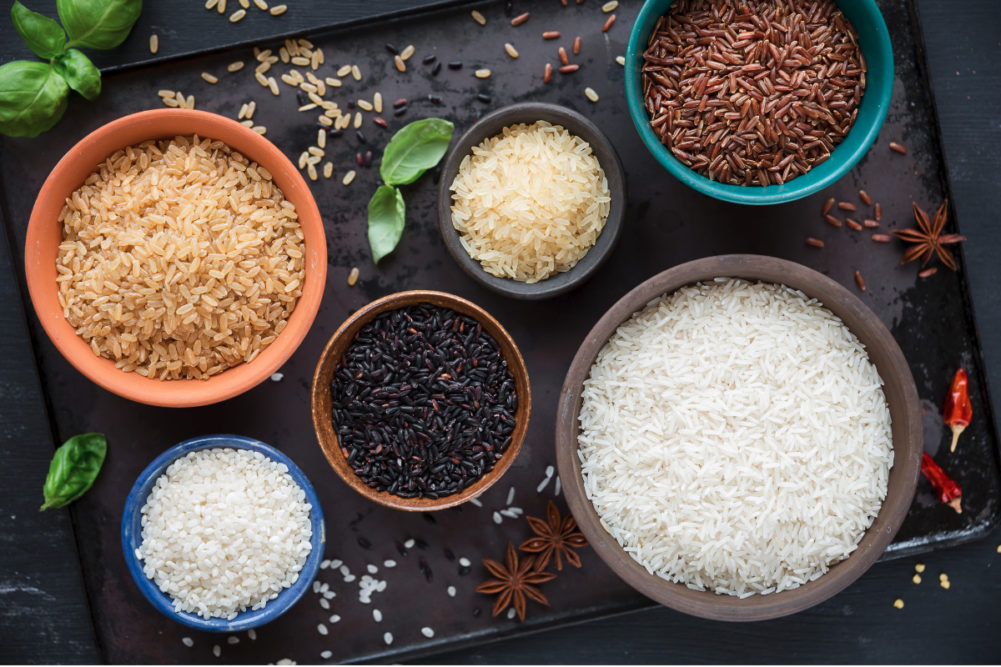
Among the more intriguing and mysterious grains deserving a hard look is rice. Intriguing because for an extended period from the 1970s through the 1990s, rice enjoyed explosive growth in per capita consumption. Mysterious because the US Department of Agriculture no longer tracks data on rice consumption as food.
At a time when US wheat flour consumption was enjoying its fastest growth, beginning in the early 1970s, rice was growing faster — much faster. From 1970 to 2000, per capita consumption jumped to 19.2 lbs, up 147% from 7.7 lbs, according to data from the Economic Research Service of the USDA. Wheat flour consumption is far larger, but over the same 30-year period it grew 32%, to 146 lbs in 2000 from 111 lbs in 1970. Numerous factors precipitated the rice demand surge. A swell of immigration from global regions where rice is heavily consumed contributed to the demand jump, not just Southeast Asia, but other areas as well, including Africa and Latin America. Processed foods made with rice flour or other rice-based ingredients grew in popularity, including rice cakes and rice noodles. The rapid expansion in demand for ethnic foods also gave rice a boost.
Similar to the subsequent drop in wheat flour demand, the growth in rice consumption has slowed considerably in the 21st century. Between 2000 and 2010, per capita rice consumption edged up modestly, to 12 lbs from 11.3 lbs, an increase of 6.7%, or a rate in line with population growth. Fad dieting has been cited as a factor in the slowing growth. While rice demand trends are not affected by the preferences of consumers who avoid gluten, they are influenced by low-carbohydrate dieting.
Since 2010, divining rice consumption trends has become a far less precise exercise. The USDA formerly had access to US Department of Treasury data on demand from the brewing industry, a significant outlet for rice in the United States, and the trade organization USA Rice Federation for many years gathered and shared with the USDA data from rice mills. With those sources no longer available, the Department has ceased publication of annual food disappearance of rice. Instead, food use in supply/demand data is part of a Food, Industrial and Residual (FI&R) figure.
Per capita consumption estimates are not precise tools, dependent on numerous assumptions. Still, the metric is a surgical scalpel compared to the blunt instrument available to the rice sector for tracking domestic demand. The FI&R figure includes rice disappearance for direct food use, in processed foods, in pet food, in beer and all other industrial uses, plus seed use and post-harvest losses in transporting, marketing, and processing. The number swings widely from one year to the next. Still, using average FI&R figures for the last five years, it appears that food demand continues to increase slowly.
This same pattern of rapid growth in the 1970s through 1990s and then much slower demand afterward also was followed by corn products, up 180% in the earlier period and 25% from 2000-2018. Demand trends for oats, rye and barley have been less dramatic. None has been growing significantly in recent years. The success of the North American Millers’ Association in representing the wheat, corn and oat millers demonstrates the complementary nature of the industries. Combatting widening anti-grain sentiment with a united grain-based front of promotion and research merits serious consideration longer term.


