
Pro Tip: The use of texture analyzers can determine chewiness, springiness and hardness of baked goods, as well as how new ingredients change these properties.
Developing new baked goods requires getting the right flavors and mouthfeel, but these properties can be difficult to quantify. Sensory testing is impractical for every new product formulation, as it can be an expensive and time-consuming process. Texture analyzers are one tool to gain insight on mouthfeel of the product, and the data from these machines can be used as one part in recommending the best products for further development.
By processing force, time and strain graphs that come from experiments run using texture analyzers, it is possible to assign specific numbers to textural properties like chewiness and springiness, and these attributes can be obtained within minutes. Texture analyzers have been used in the baking industry to study staling in bread or analyze extruded products, and they can help in figuring out how new ingredients change the texture of baked goods in a quantifiable way.
Texture analyzers are fairly simple in design, but highly versatile in their applications, aided by a number of interchangeable probes to compress, break or stretch dough and finished products.
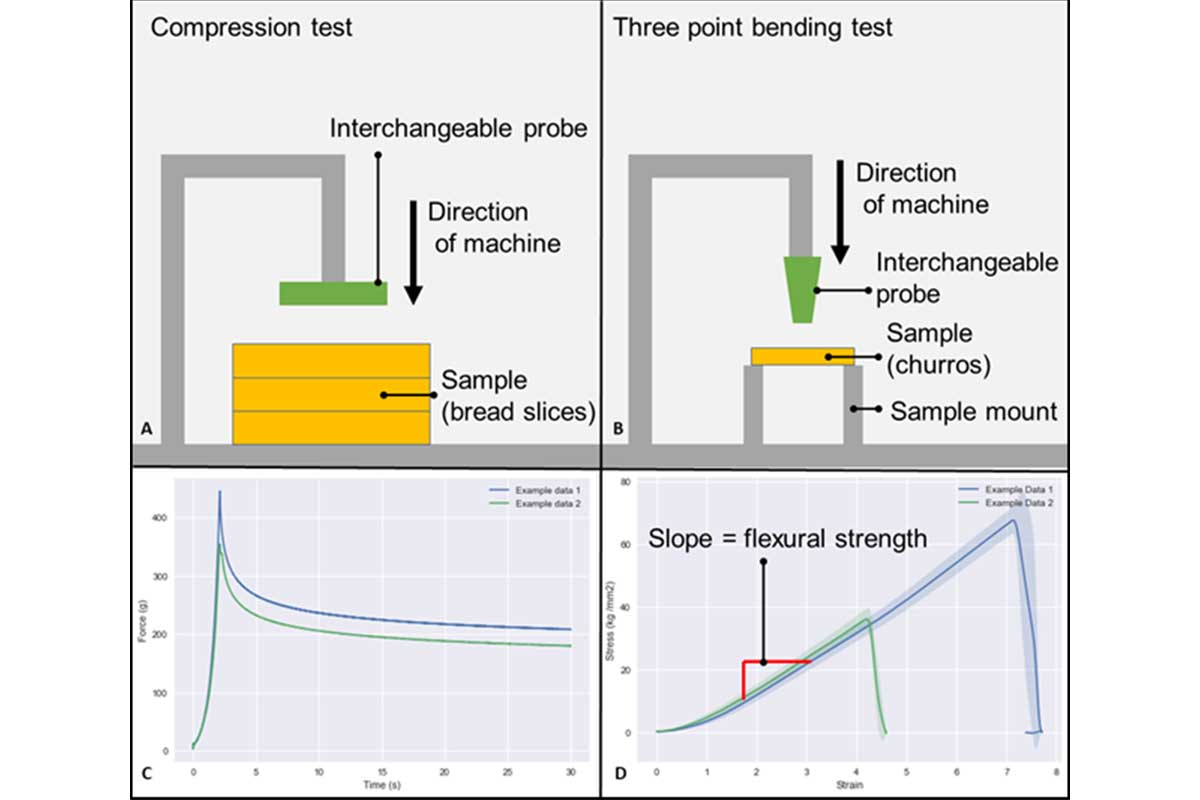
Figures 1A and B show typical set ups for compression testing and three-point bending tests that can be used to study baked goods with different shapes. Figure 1C and D show examples of data that can be extracted from each set up. In these tests, the texture analyzer moves downward, compressing or breaking the material, and the force (in grams) is recorded by the equipment. Stress is the force divided by the area of the sample. Strain is recorded by the equipment, and it is the amount that the material deforms (moves) as the result of the test, expressed as a percent.
In compression testing, it is common to perform the experiment twice on the same sample to see how much of the initial shape the material recovers after compressing it, whereas the three-point bending rig breaks the material. For compression testing, values that correlate with sensory studies can be extracted from this data fairly quickly, including hardness, springiness, cohesiveness and chewiness, as defined below:

Using the three-point bending rig, the most common metric to calculate is the flexural strength, which is the slope of the linear portion of a stress vs. strain graph (Figure 1D). Peak force and strain can also be calculated from these experiments.
Texture analysis provides objective numbers on textural properties, which can be helpful in product design. For example, if a research team has developed ten variations of a product including different levels of plant-based protein, the change in chewiness can be seen for each level of protein. Using this approach, the level of protein which would be considered acceptable by consumers can be found more quickly than with sensory testing. Texture analysis could also be done during shelf life to see how much stiffer the product becomes over time, showing when consumers may begin to reject the new products a team is developing.
Harrison Helmick is a PhD candidate at Purdue University. Connect on LinkedIn and see his other baking tips at BakeSci.com.
His research is conducted with the support of Jozef Kokini, Andrea Liceaga, and Arun Bhunia.


